Where your audience is
The states and cities with the most potential for what you sell, and those with more potential than the audience you have today.
You tell us what the brand sells. Territories crosses public data from IBGE and Cetic.br with your brand's posts and audience and answers: in which states and cities that audience lives, how much it spends, what it does online and which territories you are not in yet.
Per-brand add-on on the Pro, Agency and Enterprise plans. Public, aggregated data only: no one is identified.
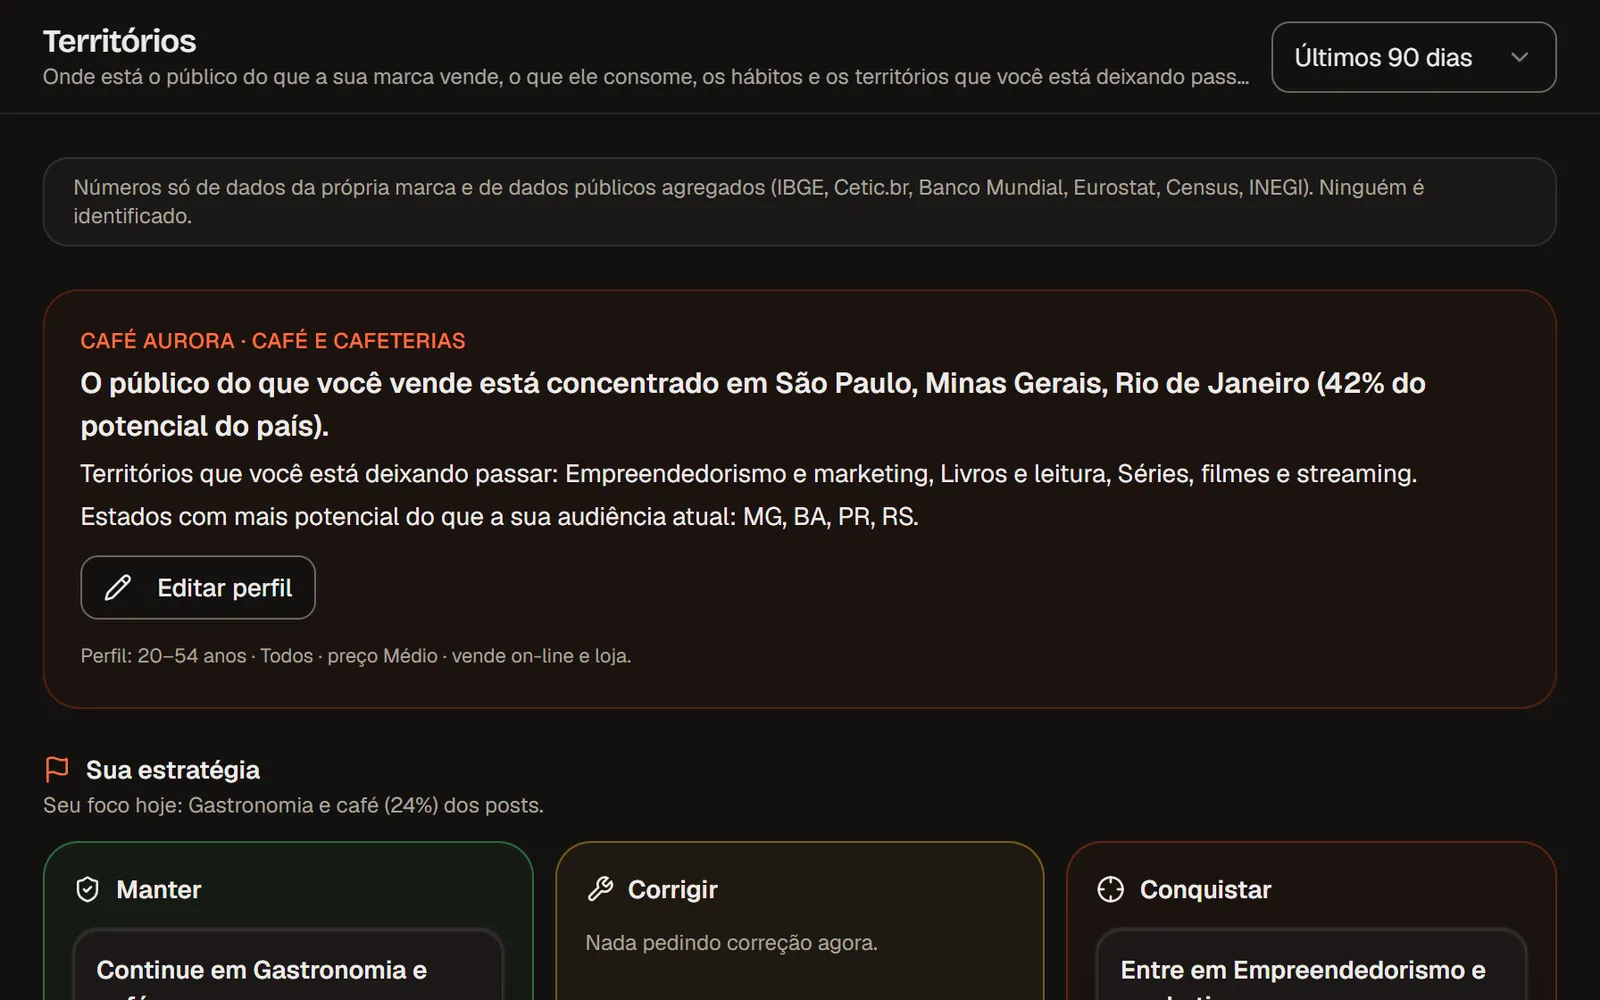
The answer first
One sentence with the summary, a three-column strategy and a 30-day plan. The numbers are right below, for whoever wants to check.
The states and cities with the most potential for what you sell, and those with more potential than the audience you have today.
How much families spend per month on your category in each income bracket and the digital habits of people who match your customer's profile.
Interest territories where your audience is and the brand barely appears, with the reason in plain language and a post plan to get in.
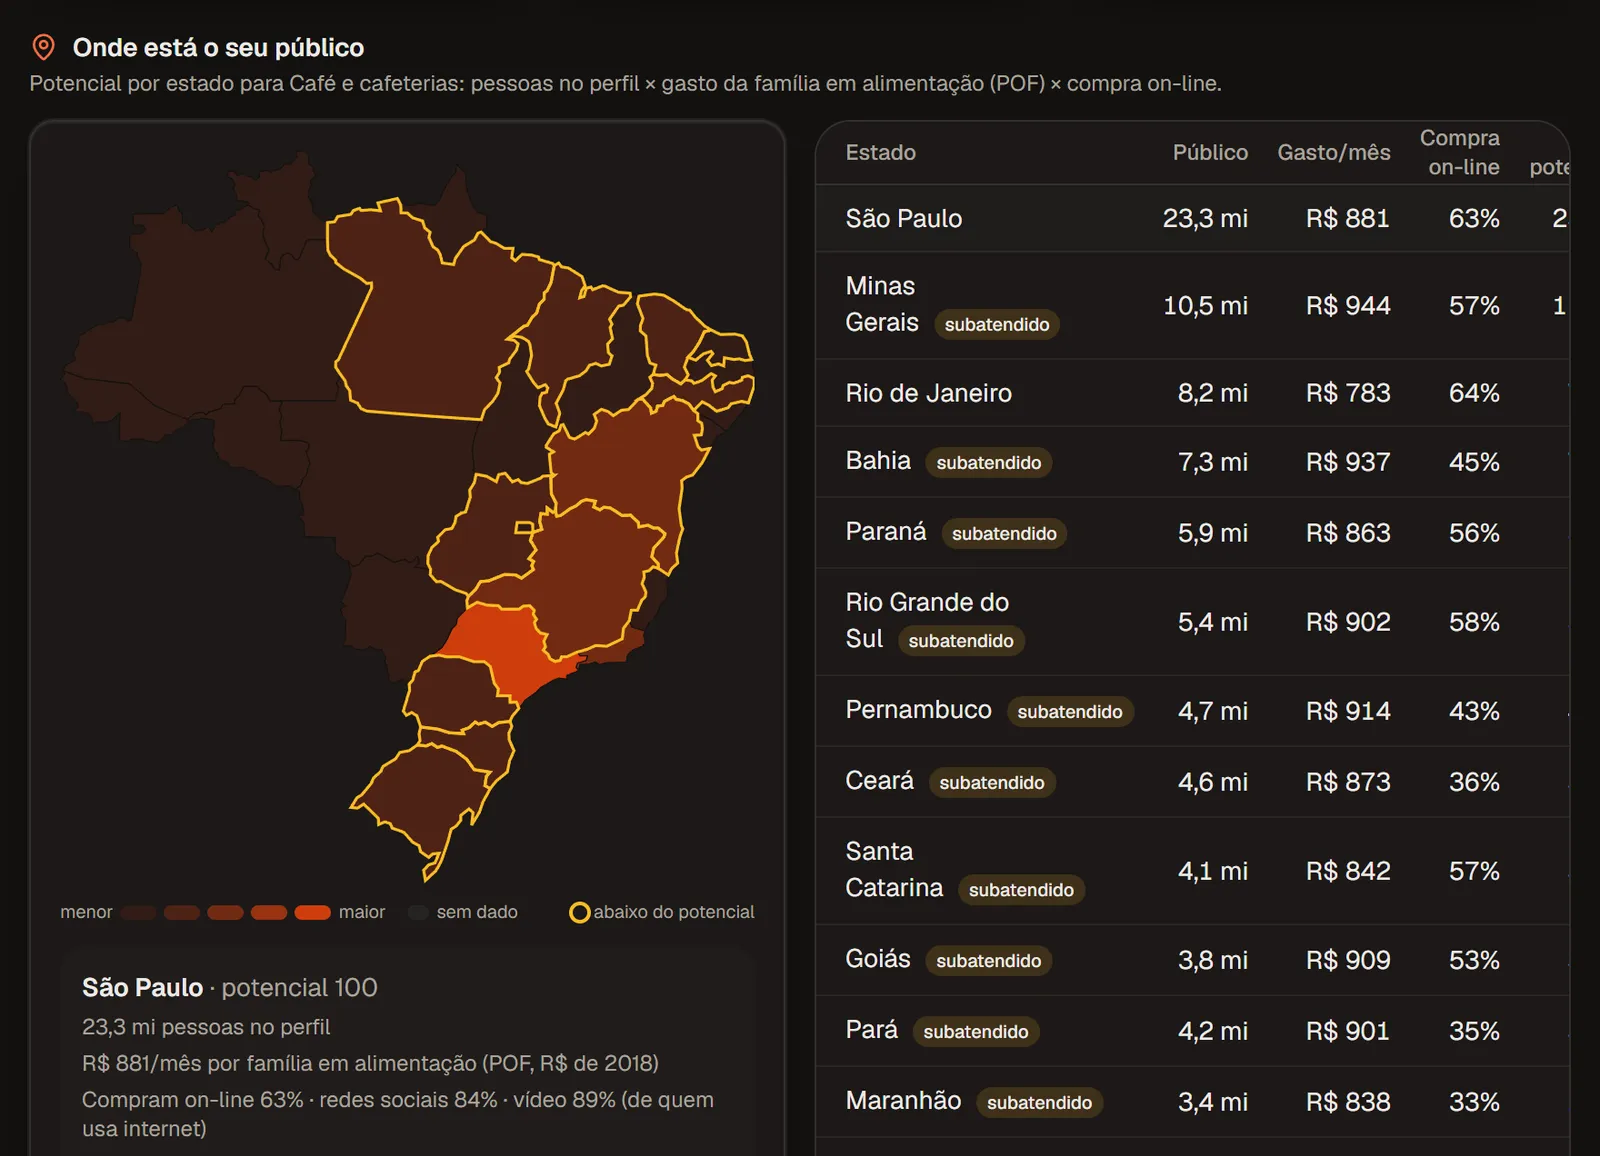
Potential map
Each place's potential combines how many people match your audience profile, how much the family spends on the category and how much it buys online. Places with high potential and low audience are flagged as underserved.
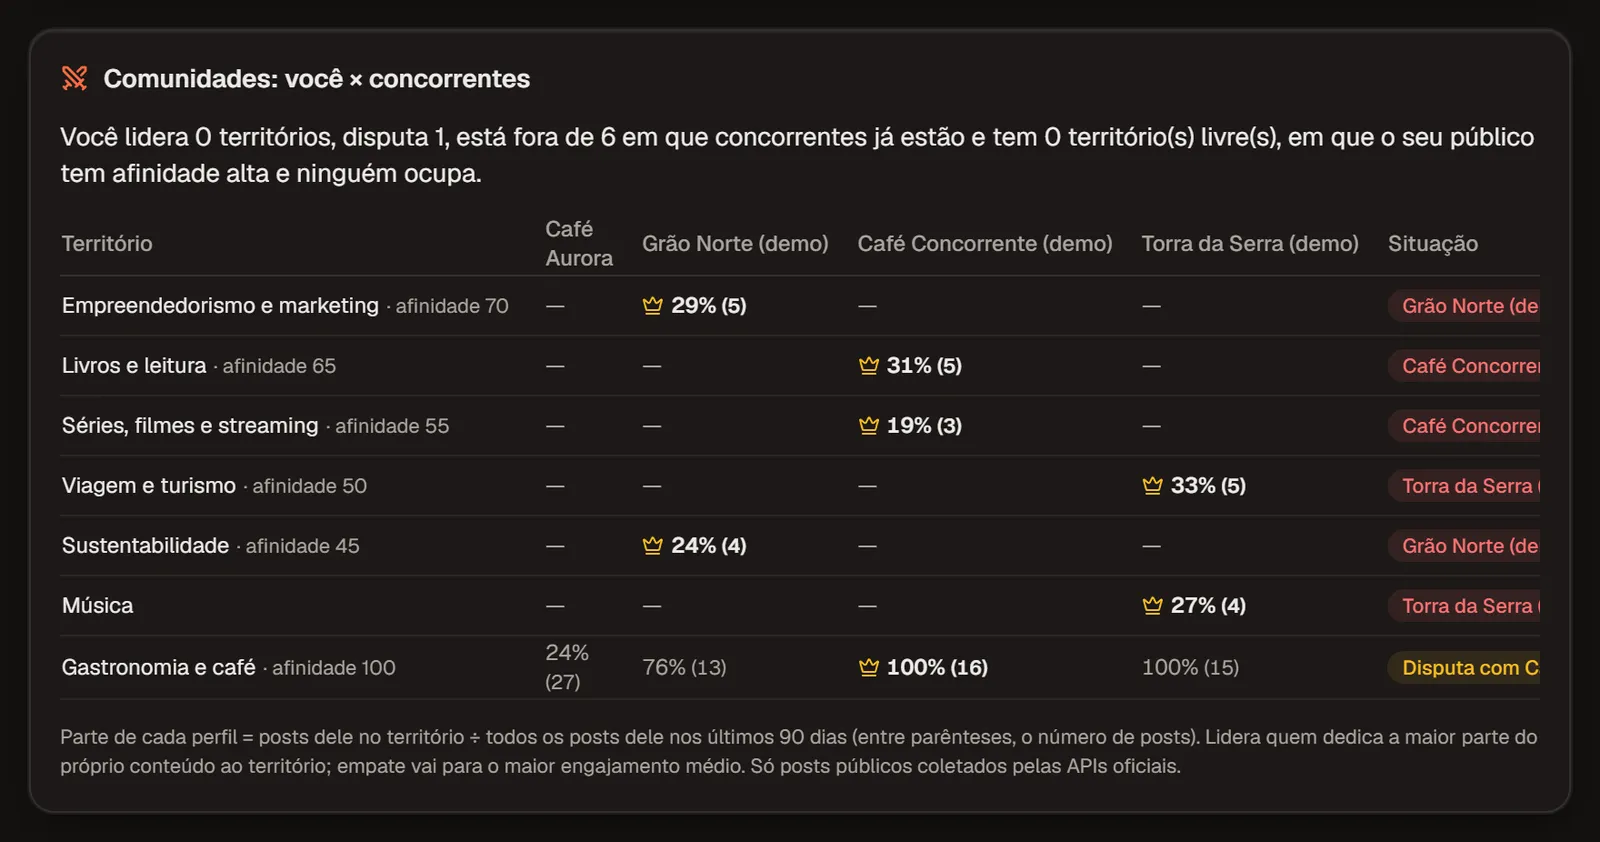
Communities and competitors
Territories compares your brand with the competitors you track, territory by territory, through each one's public posts. It shows where you lead, where you contest, where a competitor is and you are not, and the open territories where your audience has high affinity.
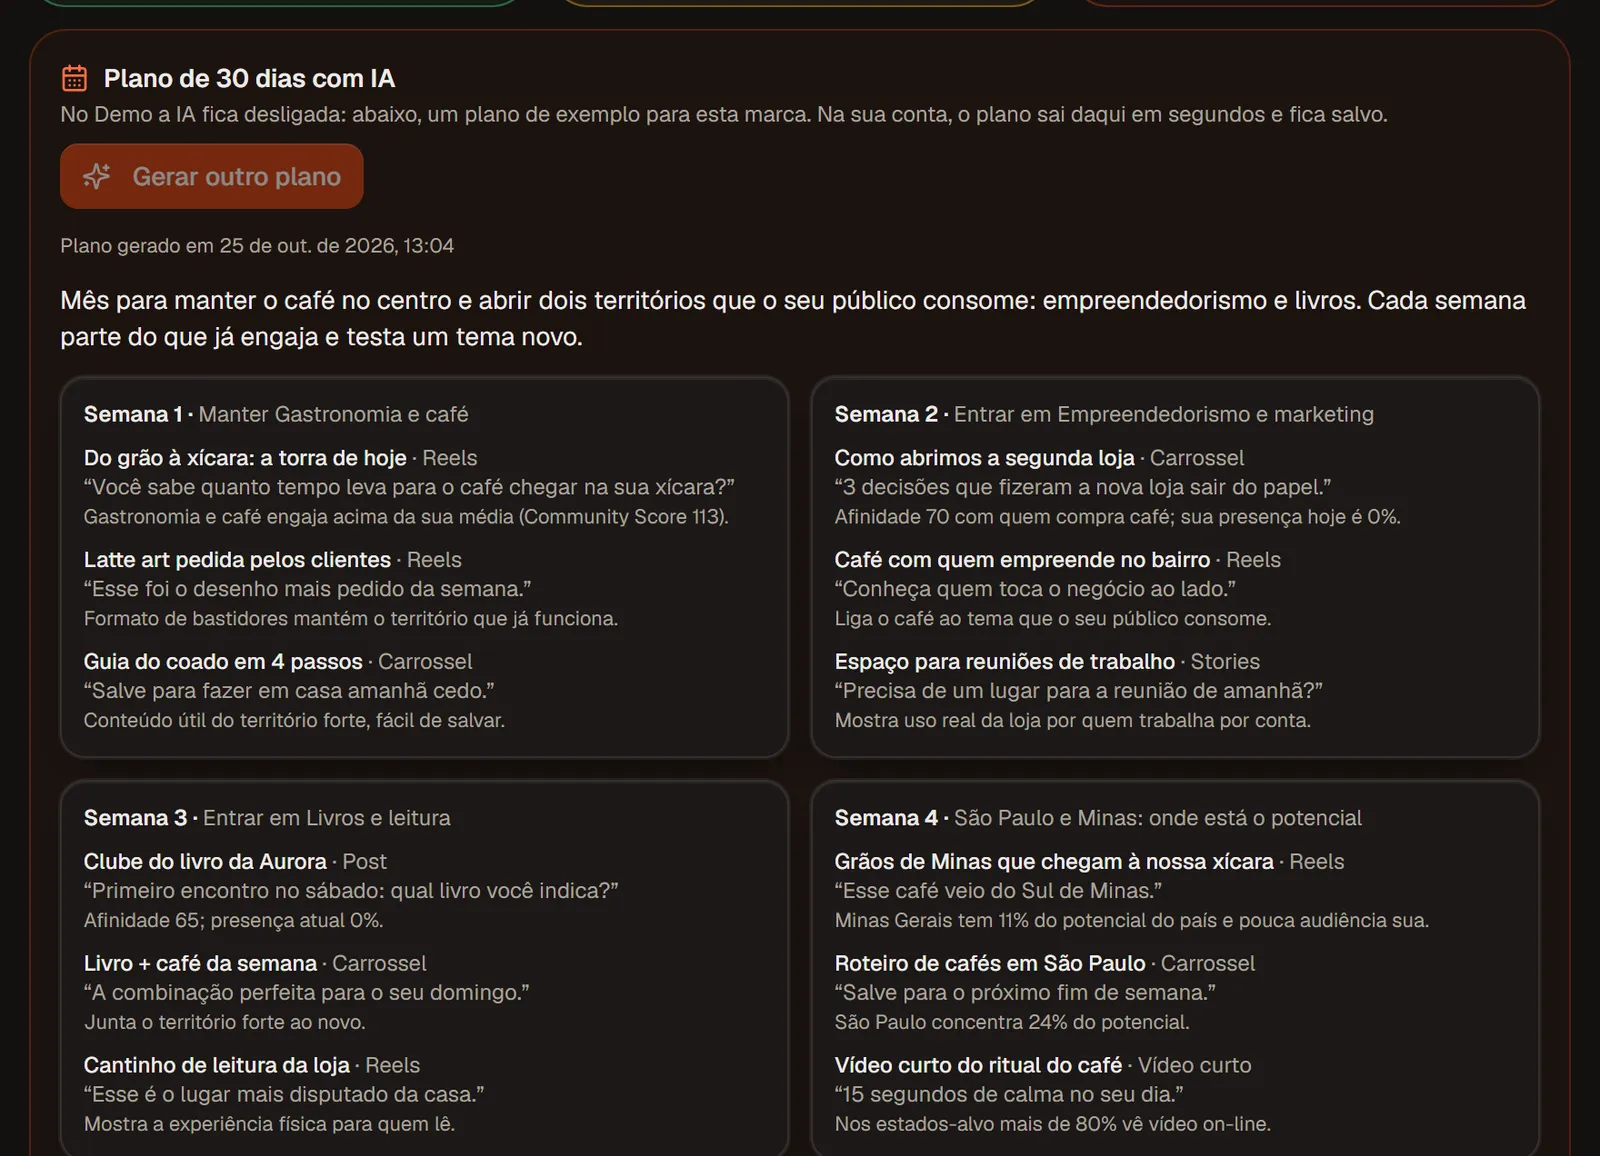
Strategy and plan
Territories separates what already works, what needs adjusting and where to enter. AI turns it into a four-week plan with the topic, format and hook of each post, which you take straight to the Studio.
How it works
Category, main products, age range, audience, price range and where you sell.
IBGE (Census, POF, PNAD TIC), Cetic.br and, outside Brazil, Census, INEGI, Eurostat and the World Bank.
Topics of your posts, mentions and, with Instagram connected, your audience's cities.
Where the audience is, what it consumes, the territories you are missing and the 30-day plan.
Method and sources
Territories works with official surveys and the brand's own data. We don't buy lists, we don't listen to private conversations and we don't identify people.
$29/month per brand, on the Pro, Agency and Enterprise plans.
Includes map, cities, consumption, habits, strategy, goals and before and after. The 30-day plan uses 2 AI credits. Billed monthly; you buy it on the Territories screen in the app.
Questions
Create your account, describe the brand and see the map, the strategy and the plan. Or first open the complete Territories in the Demo.
Free plan for those just starting · No credit card · Upgrade when you grow
Essential cookies and, if you accept, website statistics (Google Analytics). Learn more in our Privacy Policy.
Essential cookies and optional statistics
We use cookies and local storage to keep you signed in and remember your preferences. If you accept, the public website pages also measure visits with Google Analytics (no advertising); declining changes nothing in how you use Virio. In accordance with Brazil's LGPD (Law No. 13,709/2018). Learn more in our Privacy Policy.